The PLA Positions report is part of PLA Research and reveals valuable insights into your competitors’ Product Listing Ads in Google Shopping results. It allows you to compare price points, ad trends, keyword volumes, and live SERP examples from a single dashboard.
Here is how you can access the PLA Positions report:
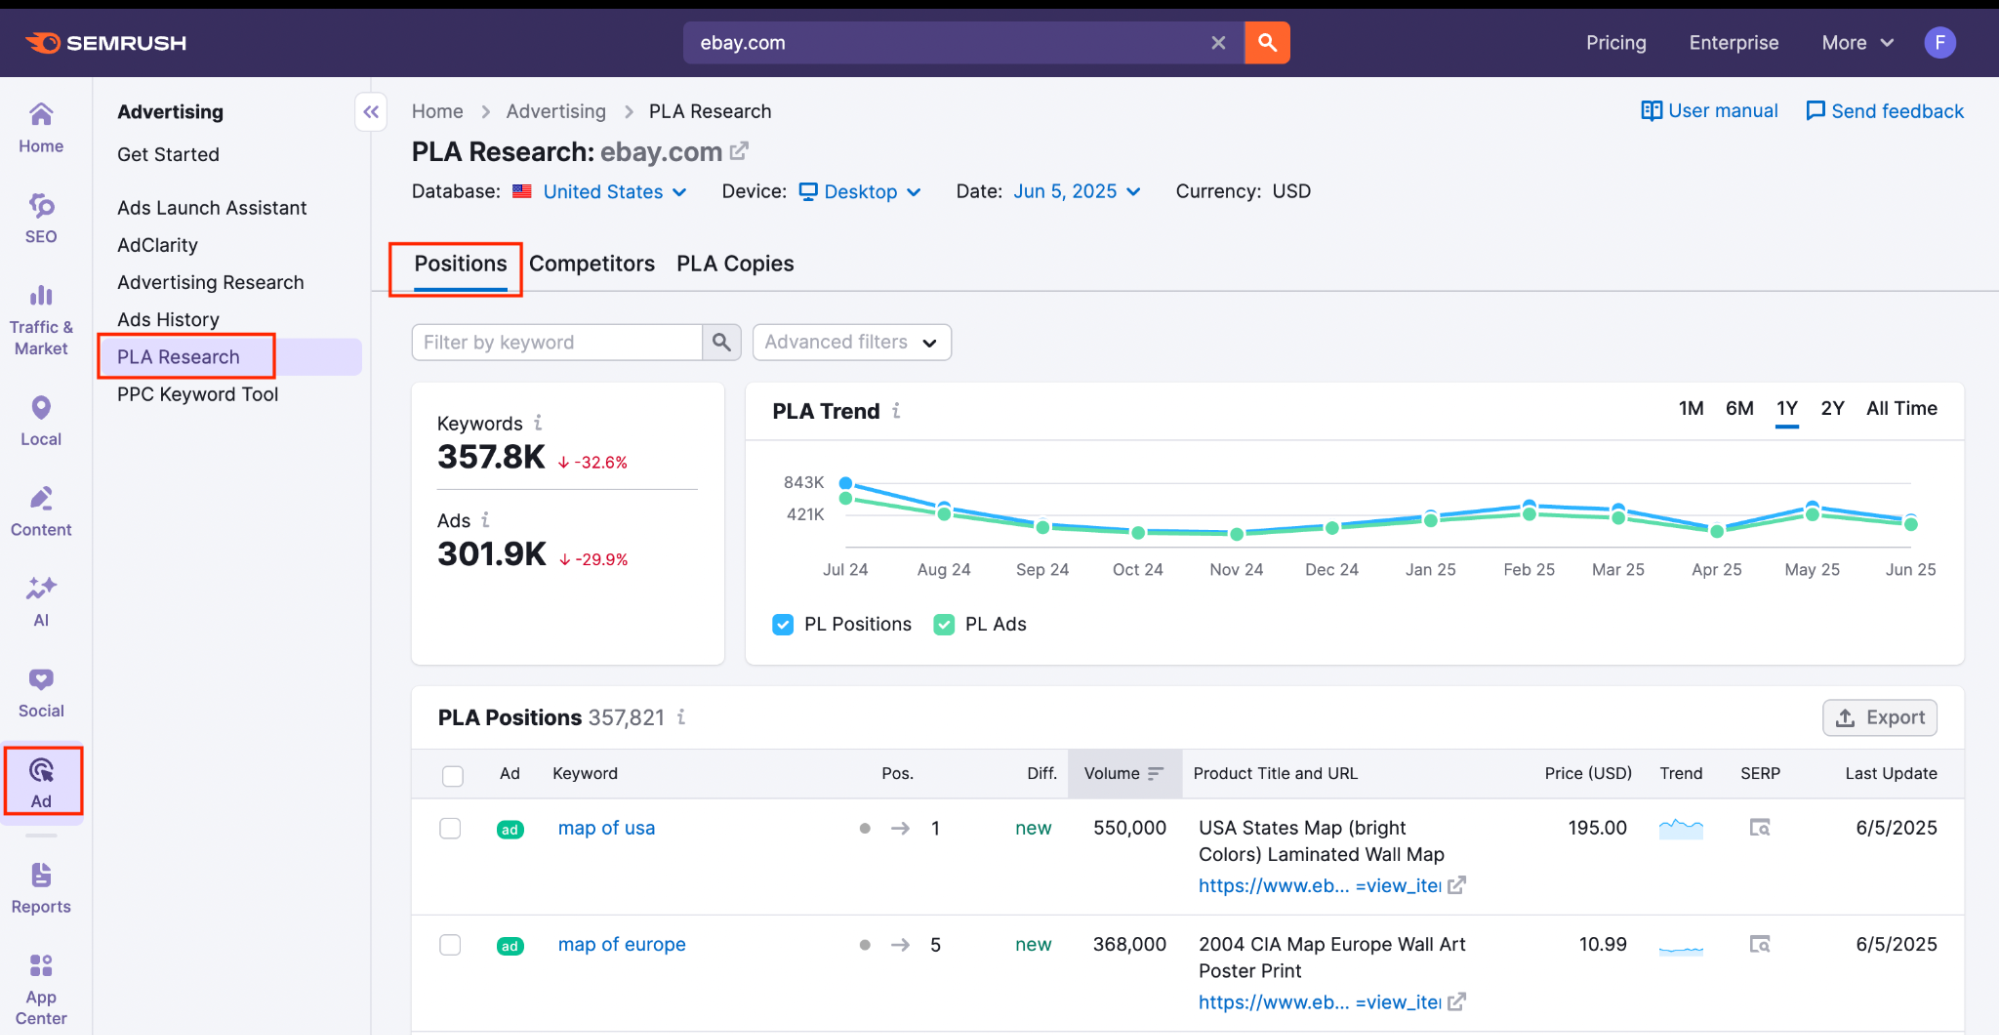
- Go to the PLA Research tool.
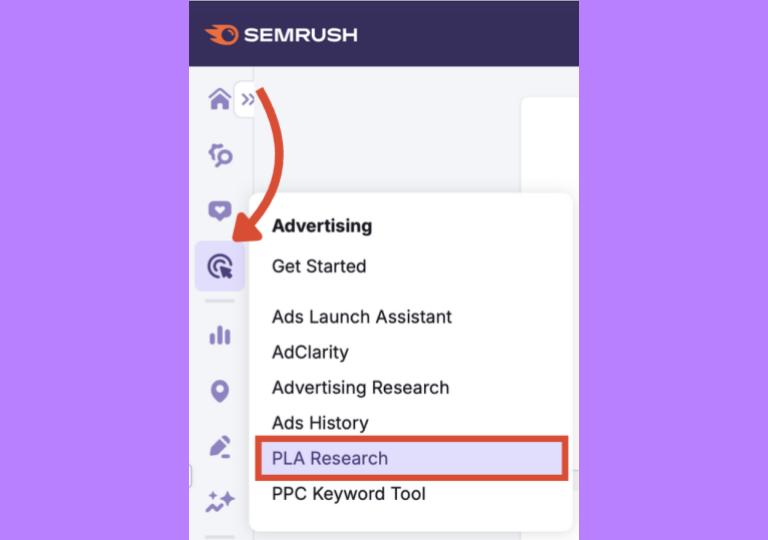
- Enter a competing domain in the search bar.

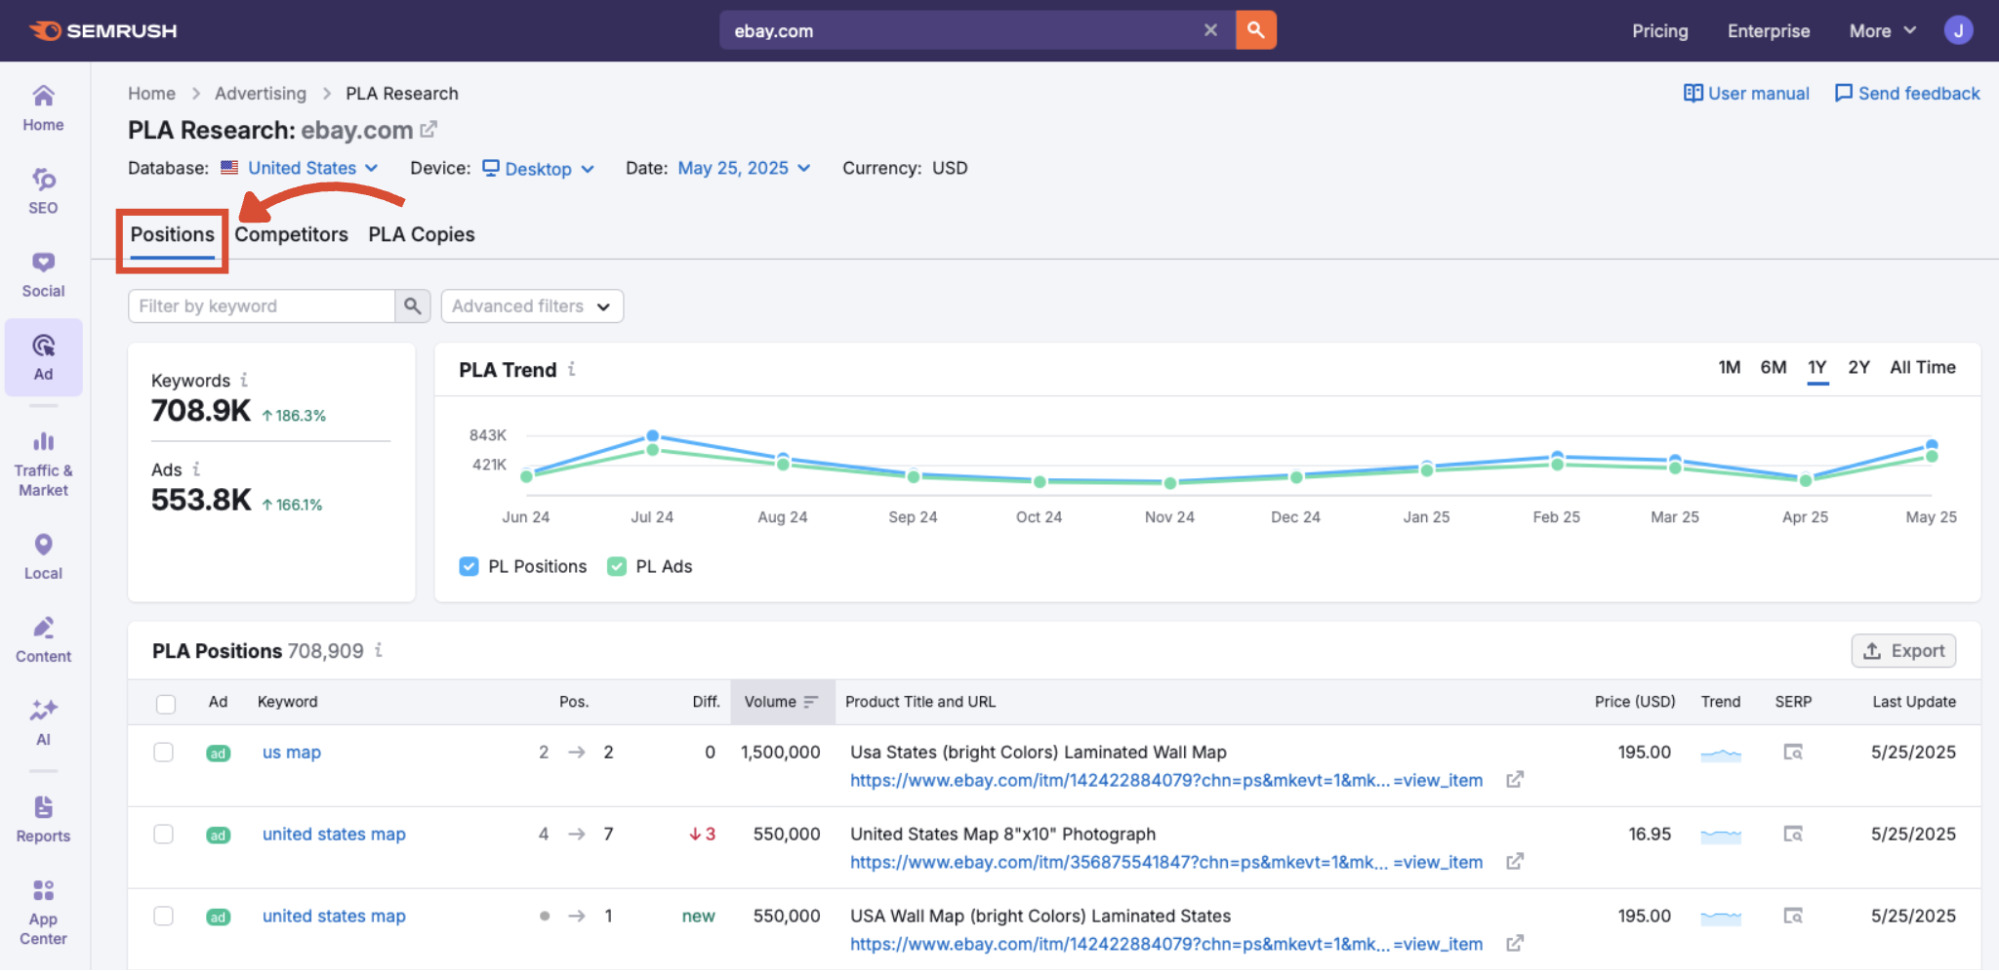
- Click the Positions tab from the PLA Research navigation menu.
Visualize Competitor Keyword Reach Over Time
Before diving into individual ads, it’s helpful to zoom out and understand how active your competitor has been over time.
This section walks you through the top of the PLA Positions report, where you can explore overall keyword coverage, ad volume, and how these metrics change month by month. Historical data is also available, going back to 2012.
Step 1: Enter a Domain
If you followed the previous steps, you’ll already have a PLA Positions report for your chosen competitor. To change competitors, type the new competitor domain into the search bar.
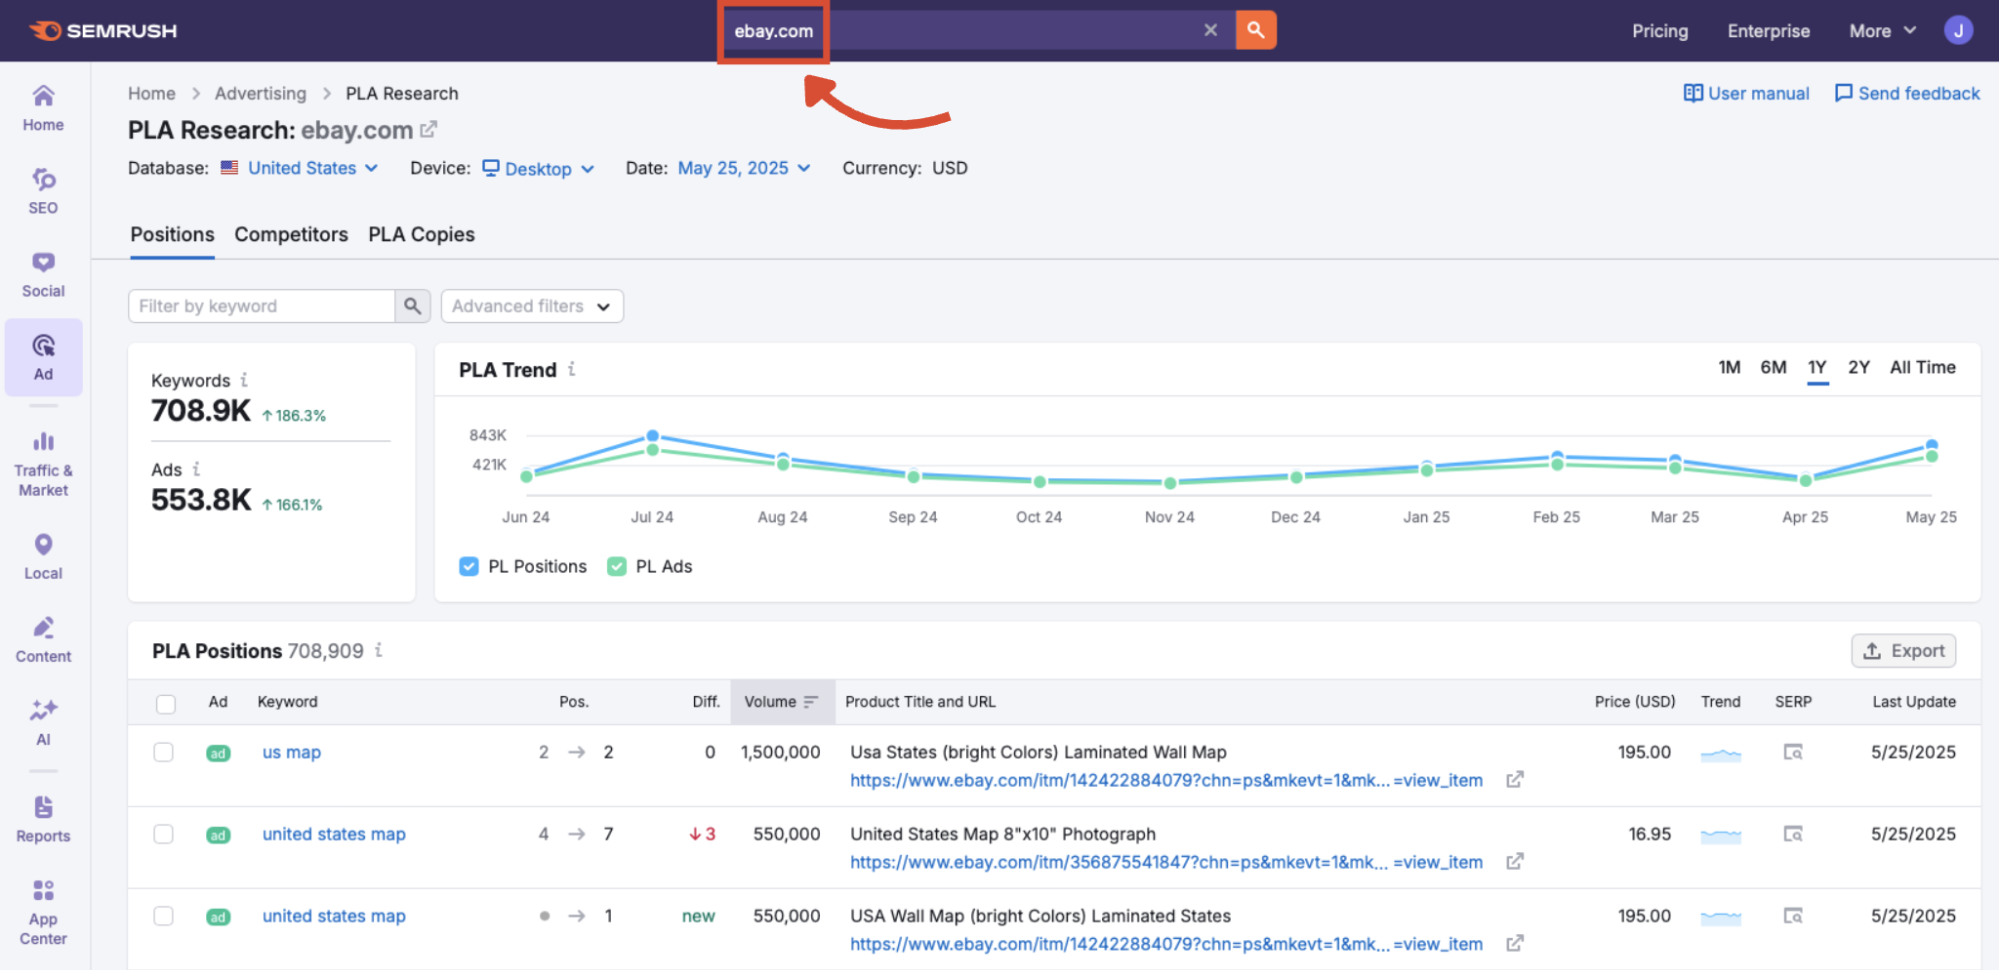
Click the orange search button to load the PLA data.
Step 2: Adjust Macro Parameters
Across the top of the dashboard, you’ll find four macro settings:
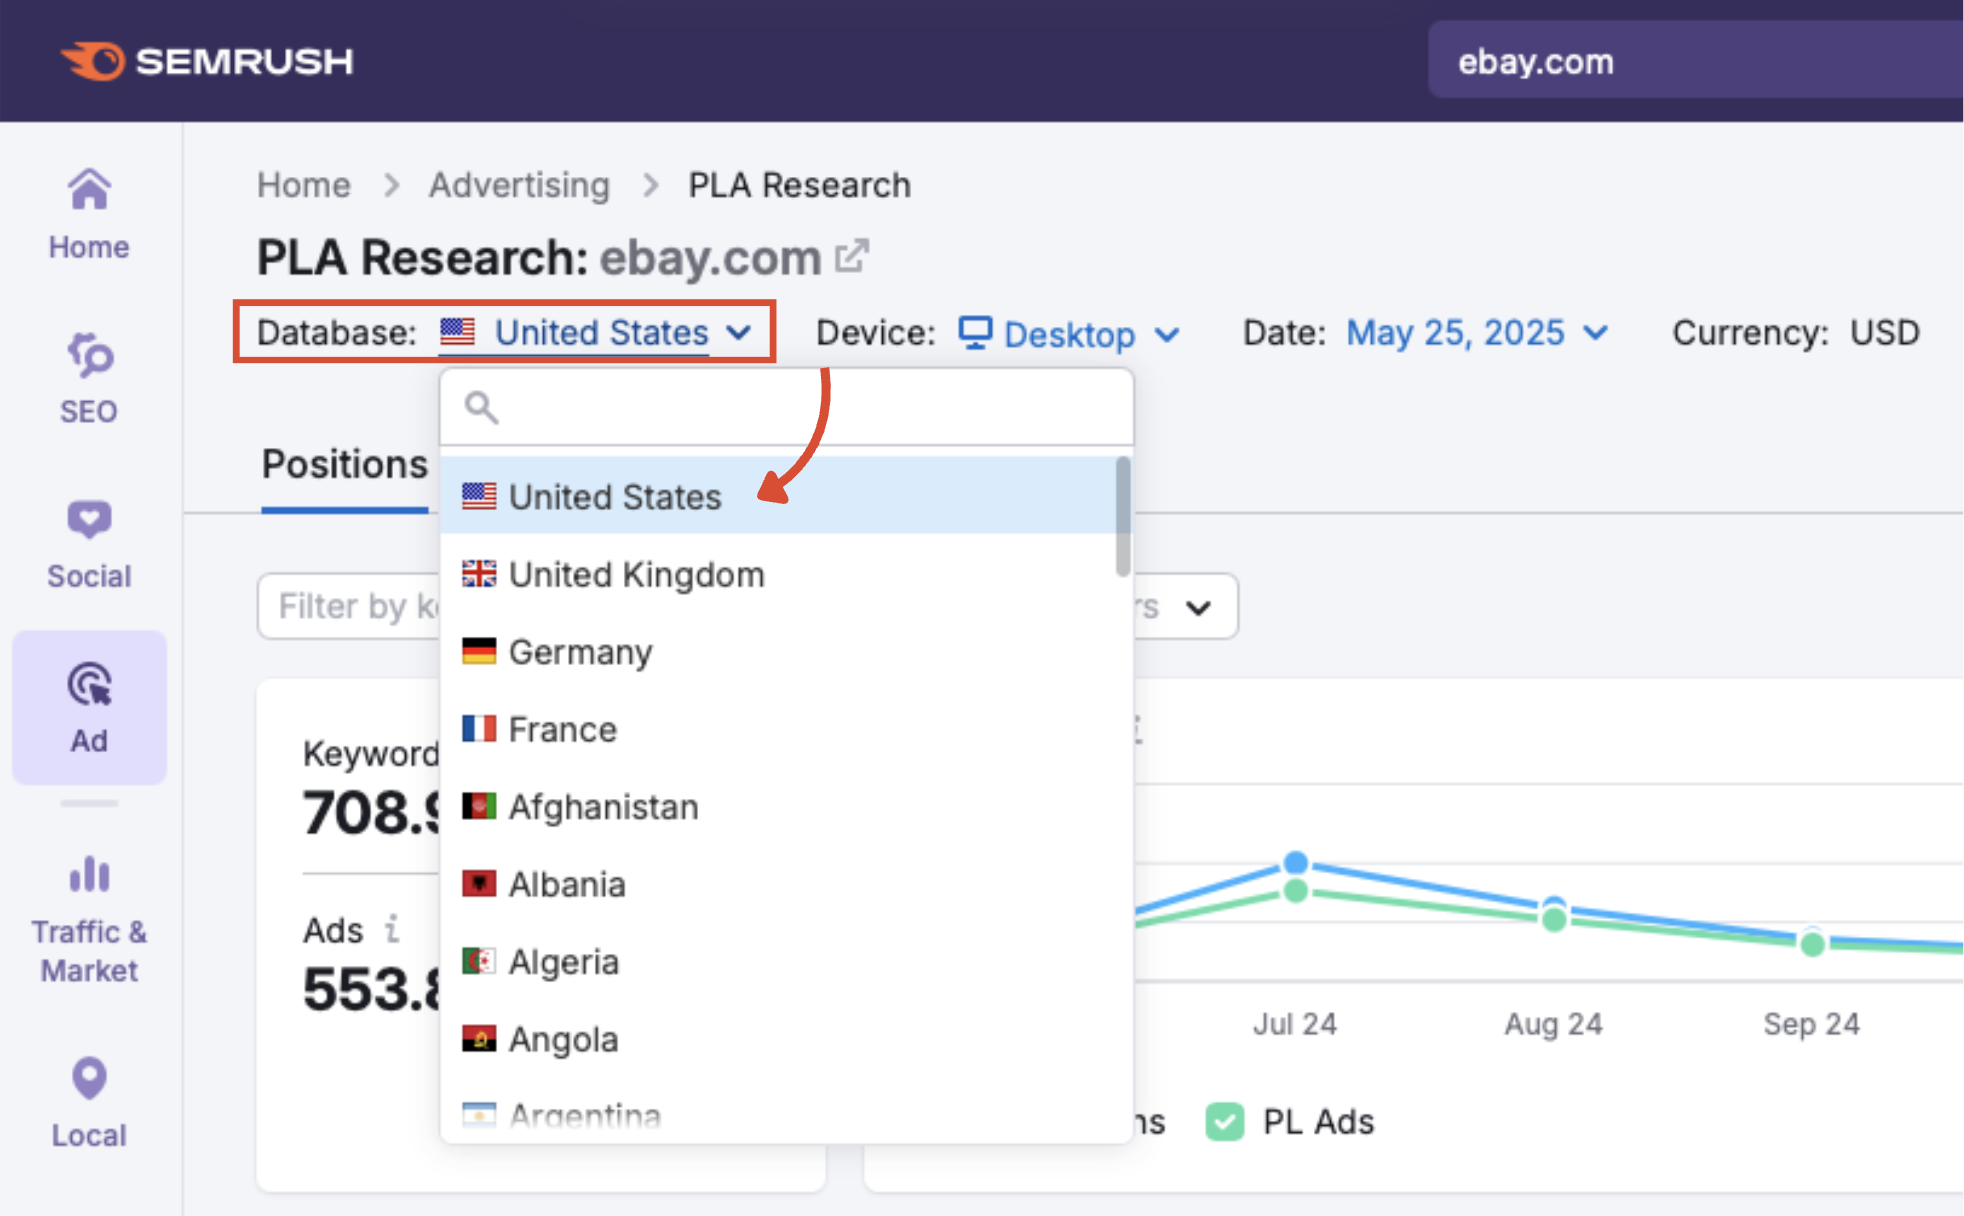
- Database — pick the country or market you'd like to analyze
- Device — monitor data based on the device or instrument used
- Date — define the timeframe for your analysis
- Currency — display the market values in the chosen currency
Database
Select the country you want to analyze.
Device
Choose between desktop or mobile PLA data.

Date
View results for a specific month‒you can go back as far as 2012.

Currency
Automatically adjusts ad price values to match your local market (database).

Step 3: Understand the PLA Trend graph
The PLA Trend graph shows the number of keywords (PL Positions) and ads (PL Ads) the competitor is bidding on across a chosen date range.

By default, the graph displays monthly data over the past 12 months. You can switch to shorter or longer time frames using the filter above the graph.
Use the PLA Trend graph to:
- Spot seasonal trends in competitor ad activity
- Gauge consistency and ad volume over time
- Benchmark your campaign scale against theirs
Step 4: Apply Filters to Refine Results
Above the graph, you’ll find filters that let you narrow the dataset.
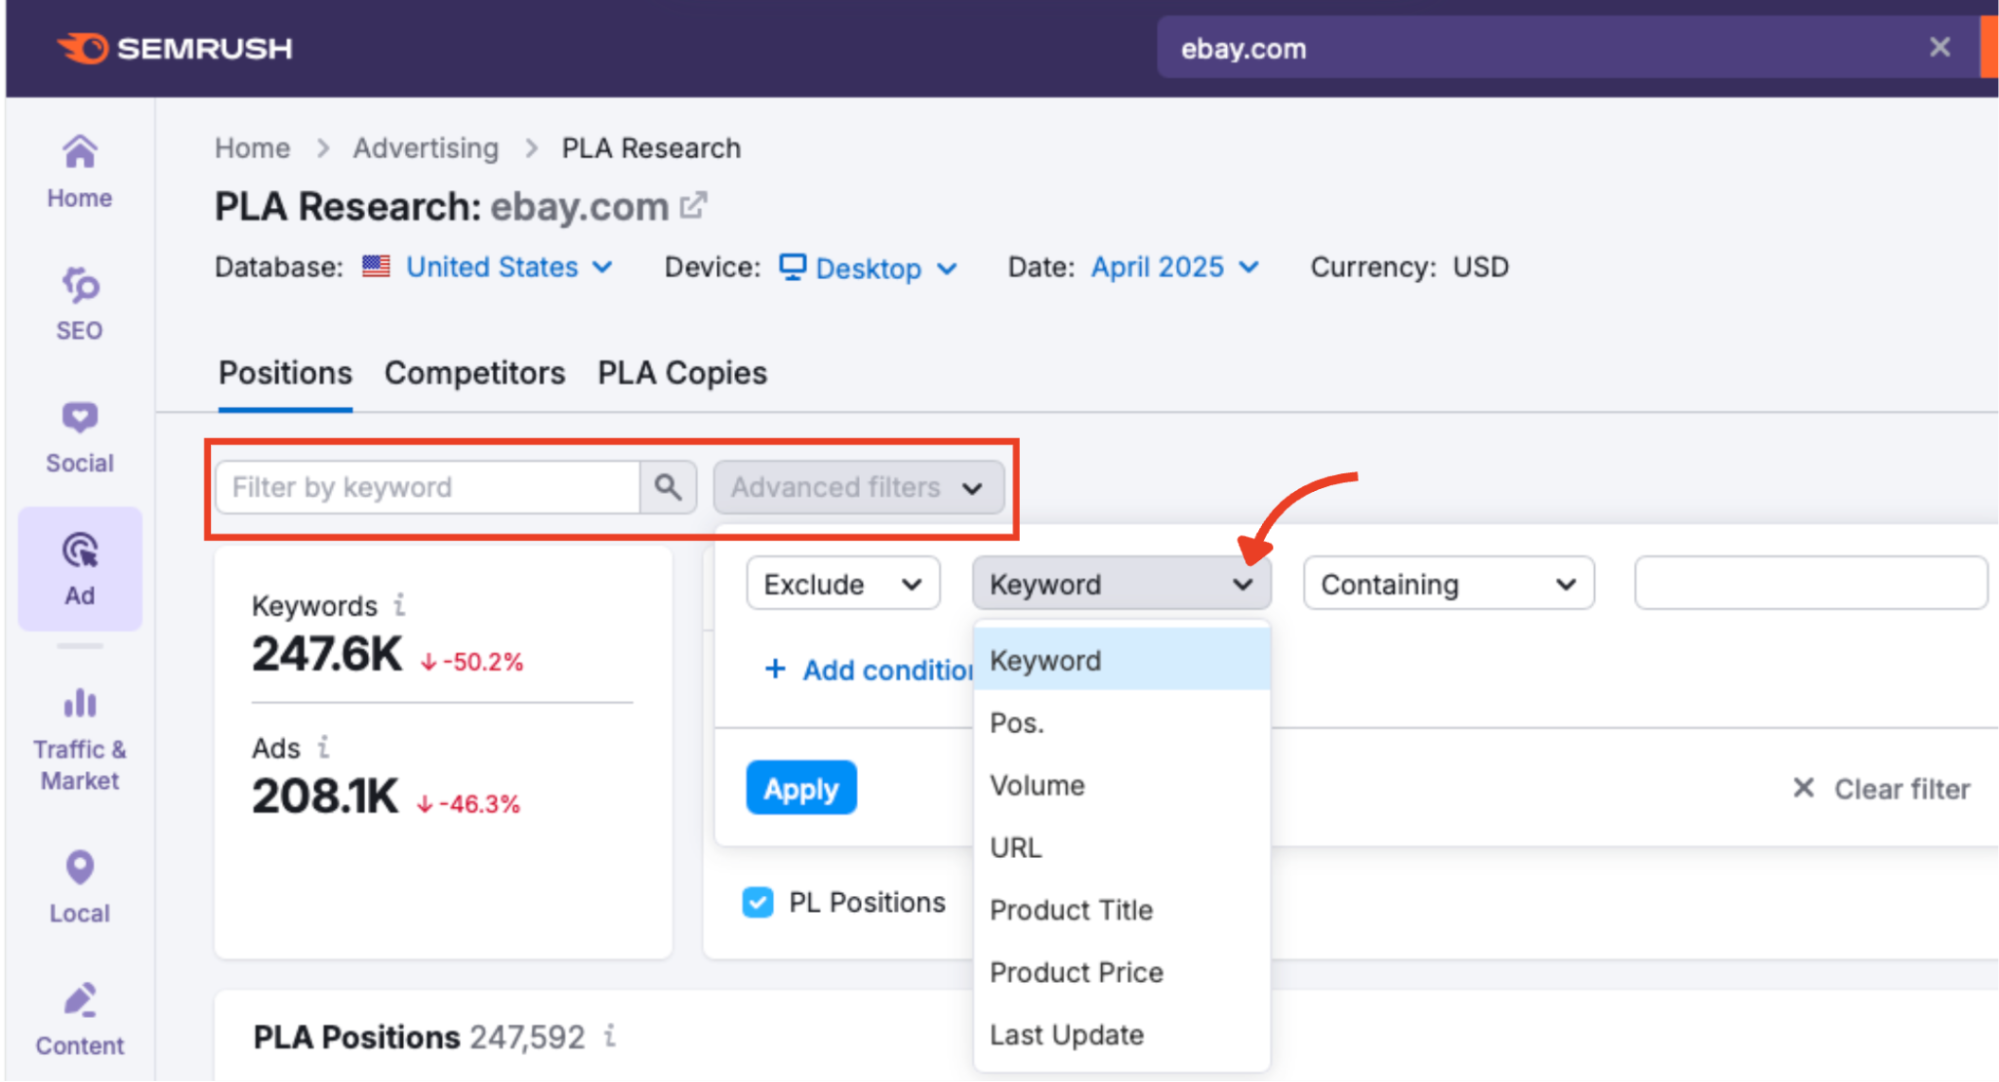
- Filter by keyword to focus on a specific product category
- Filter by position to identify top-ranking ads quickly
- Filter by volume to prioritize high-demand keywords
- Filter by URL to isolate ads pointing to specific landing pages
- Filter by product title to compare similar products
- Filter by product price to benchmark against competitor pricing
- Filter by last update to work with the most recent data
Step 5: Dive Into Each Ad’s Placement and Performance
Beneath the graph, the PLA Positions chart gives you granular insight into each of your competitor’s Product Listing Ads, including keywords, position, pricing, and visibility trends.
To access the chart, simply scroll down below the graph. You’ll see a table with several columns, each offering a different lens into how your competitor’s ads are performing.
Let’s break down what each column means:
Ad

Displays the ad preview, including the product image and truncated title. Hover to view the full ad, and click to view the product page.
Keyword

Shows the exact search term that triggered the ad. Use this to identify high-value keywords your competitors target in Google Shopping (clicking a keyword opens the full Keyword Overview report in Semrush).
Position

Indicates the ad’s ranking in the Google Shopping carousel for that keyword. A lower number means the ad appeared closer to the top.
Difference
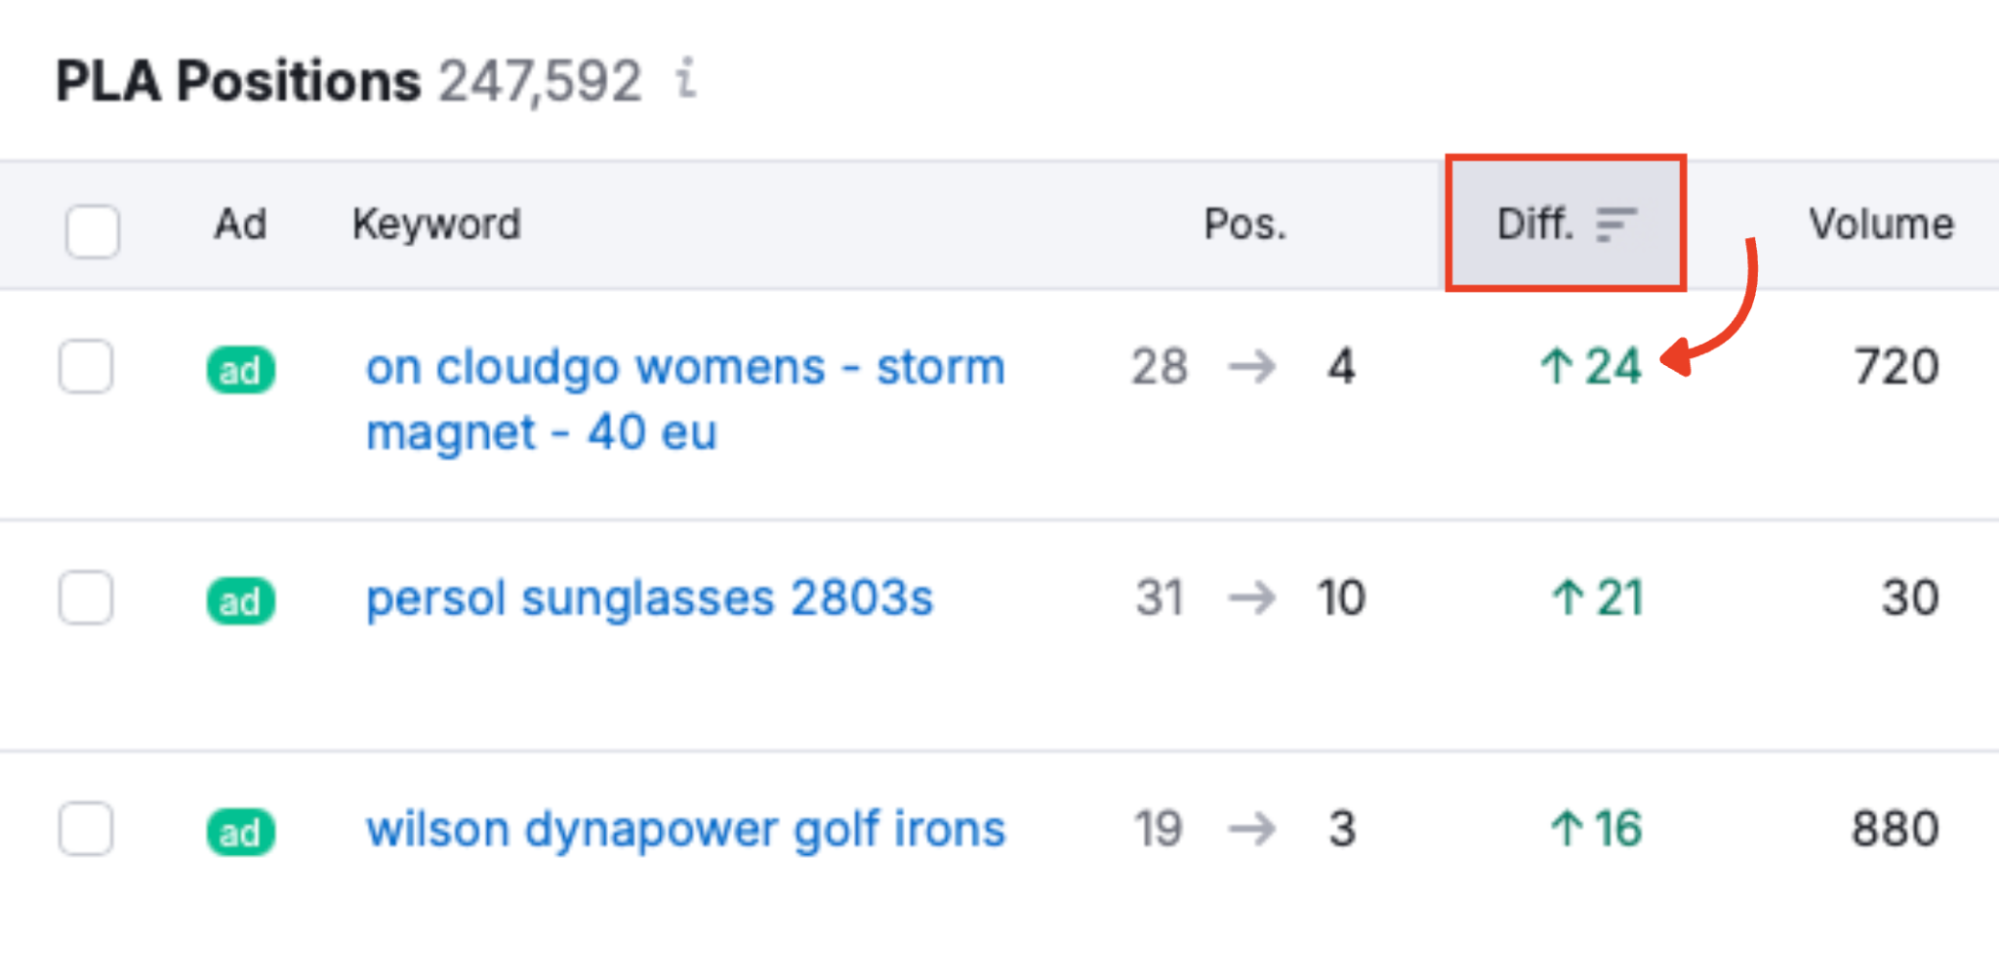
Shows the change in position since the last update. A negative number signals improvement, while a positive number indicates a drop.
Volume

Estimates monthly search volume for the keyword. Use this to prioritize keywords that are worth pursuing in relation to maximum reach.
Product Title and URL
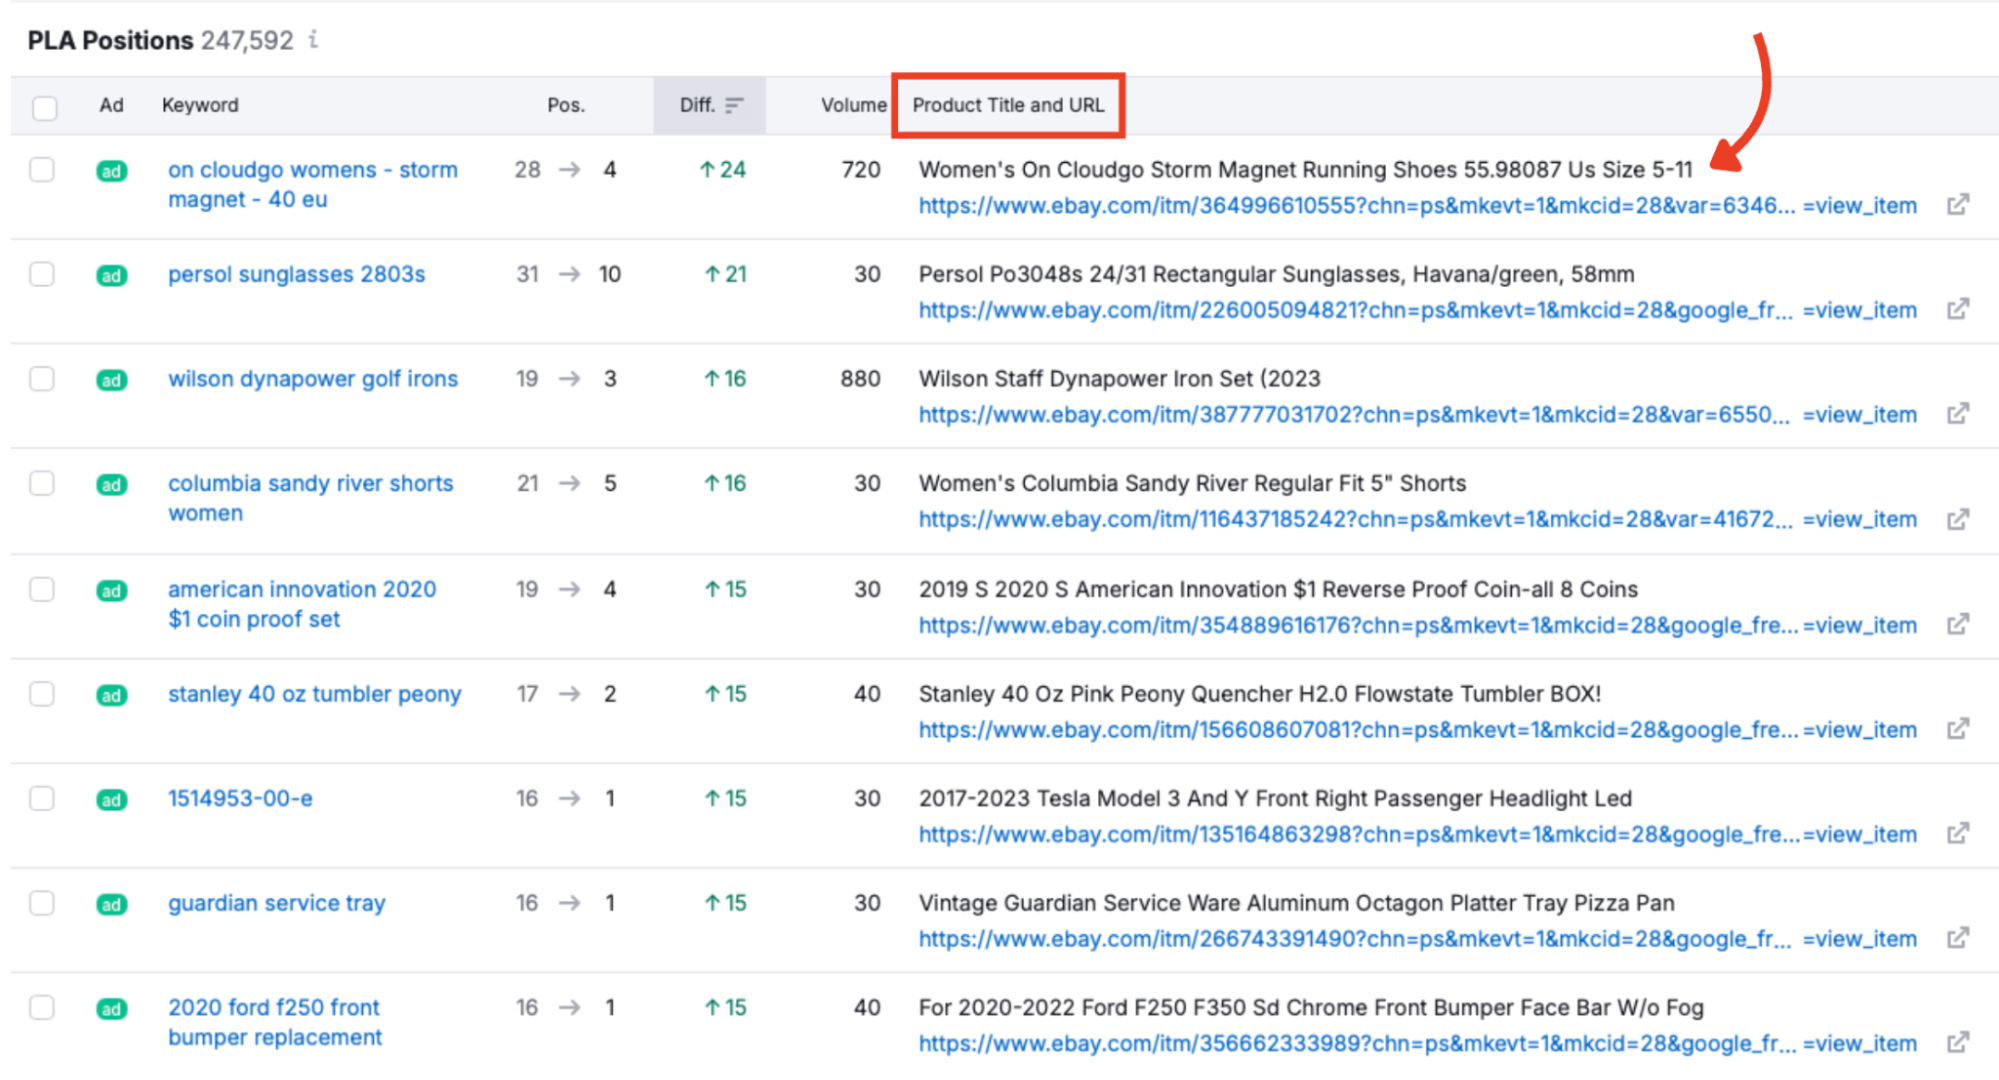
Lists the full product title used in the PLA, plus a clickable URL to the landing page.
Price

Displays the listed price of the product in the local currency (based on your database selection). Helpful for benchmarking your pricing strategy.
Trend
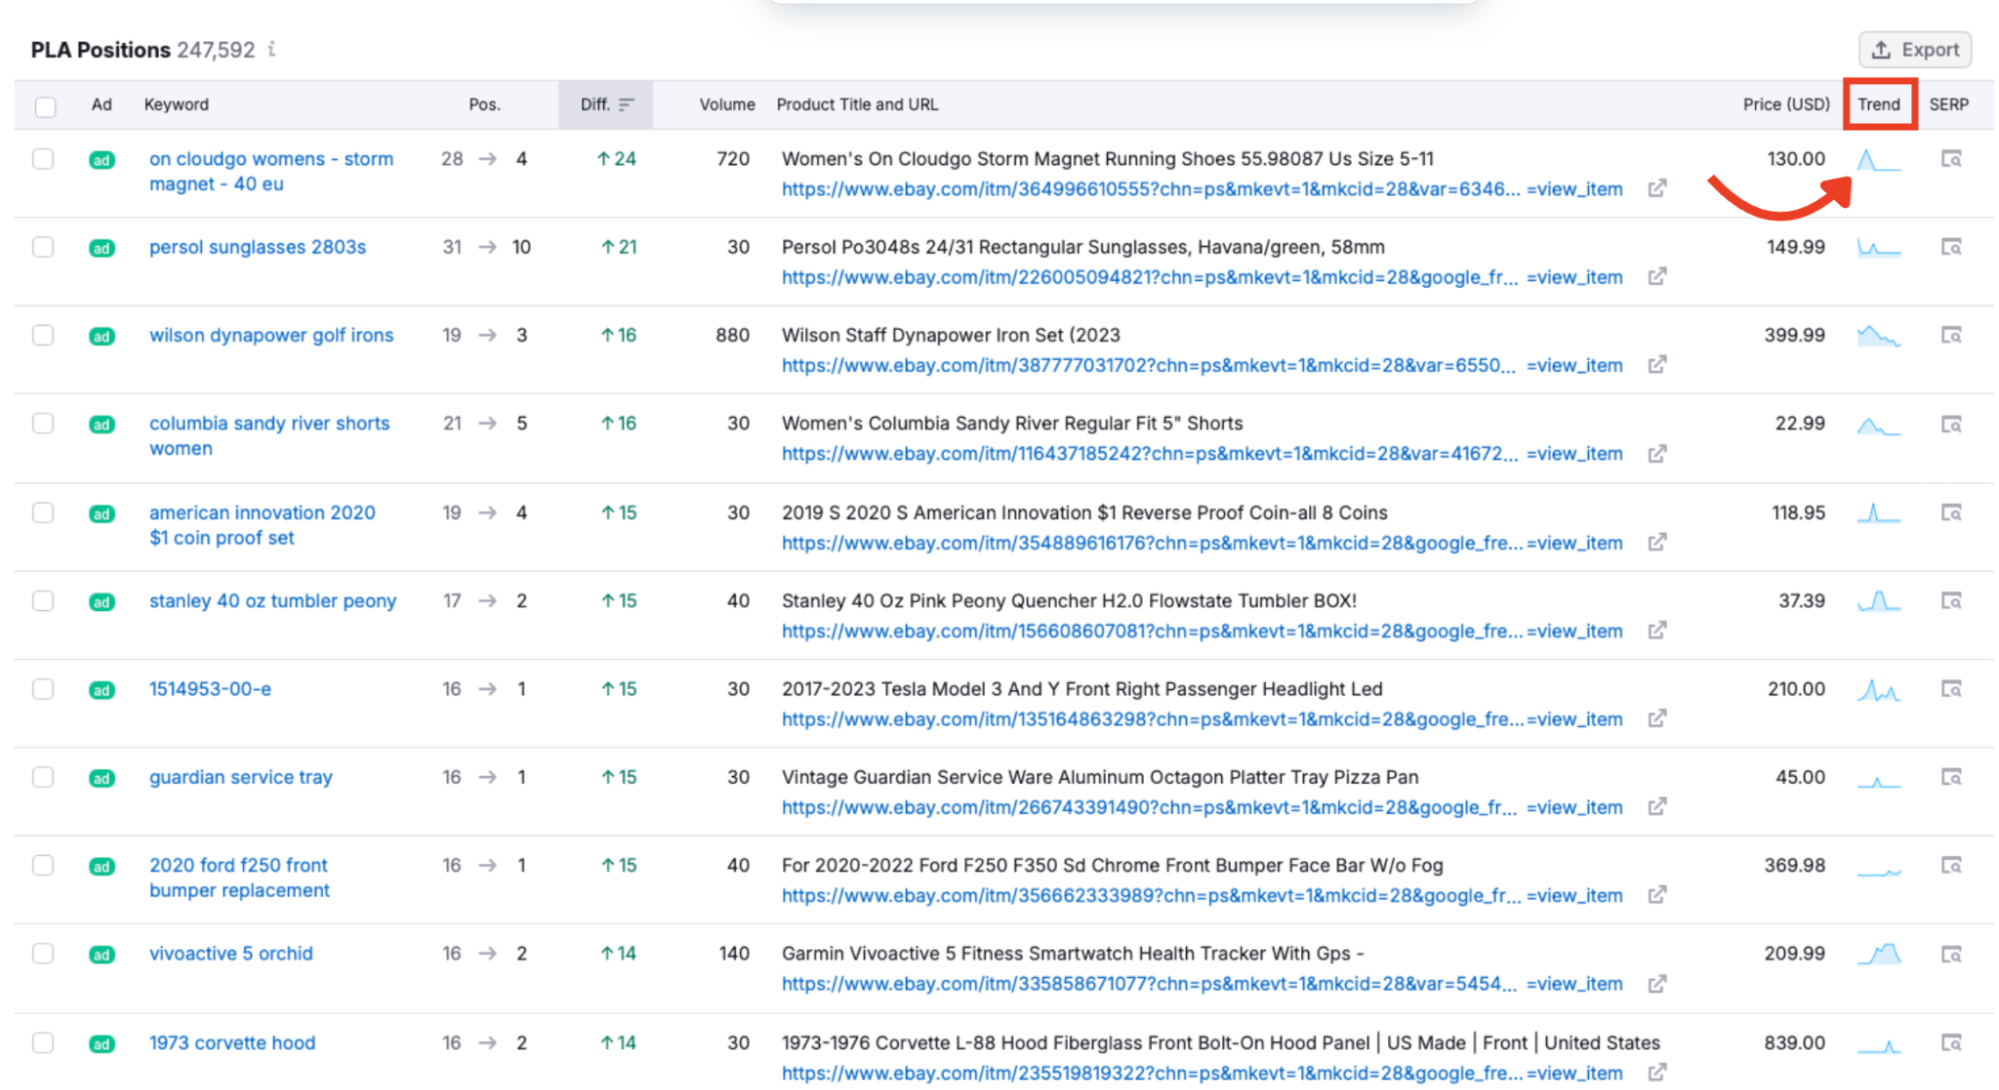
Small visual showing how the keyword’s popularity has changed over time.
SERP
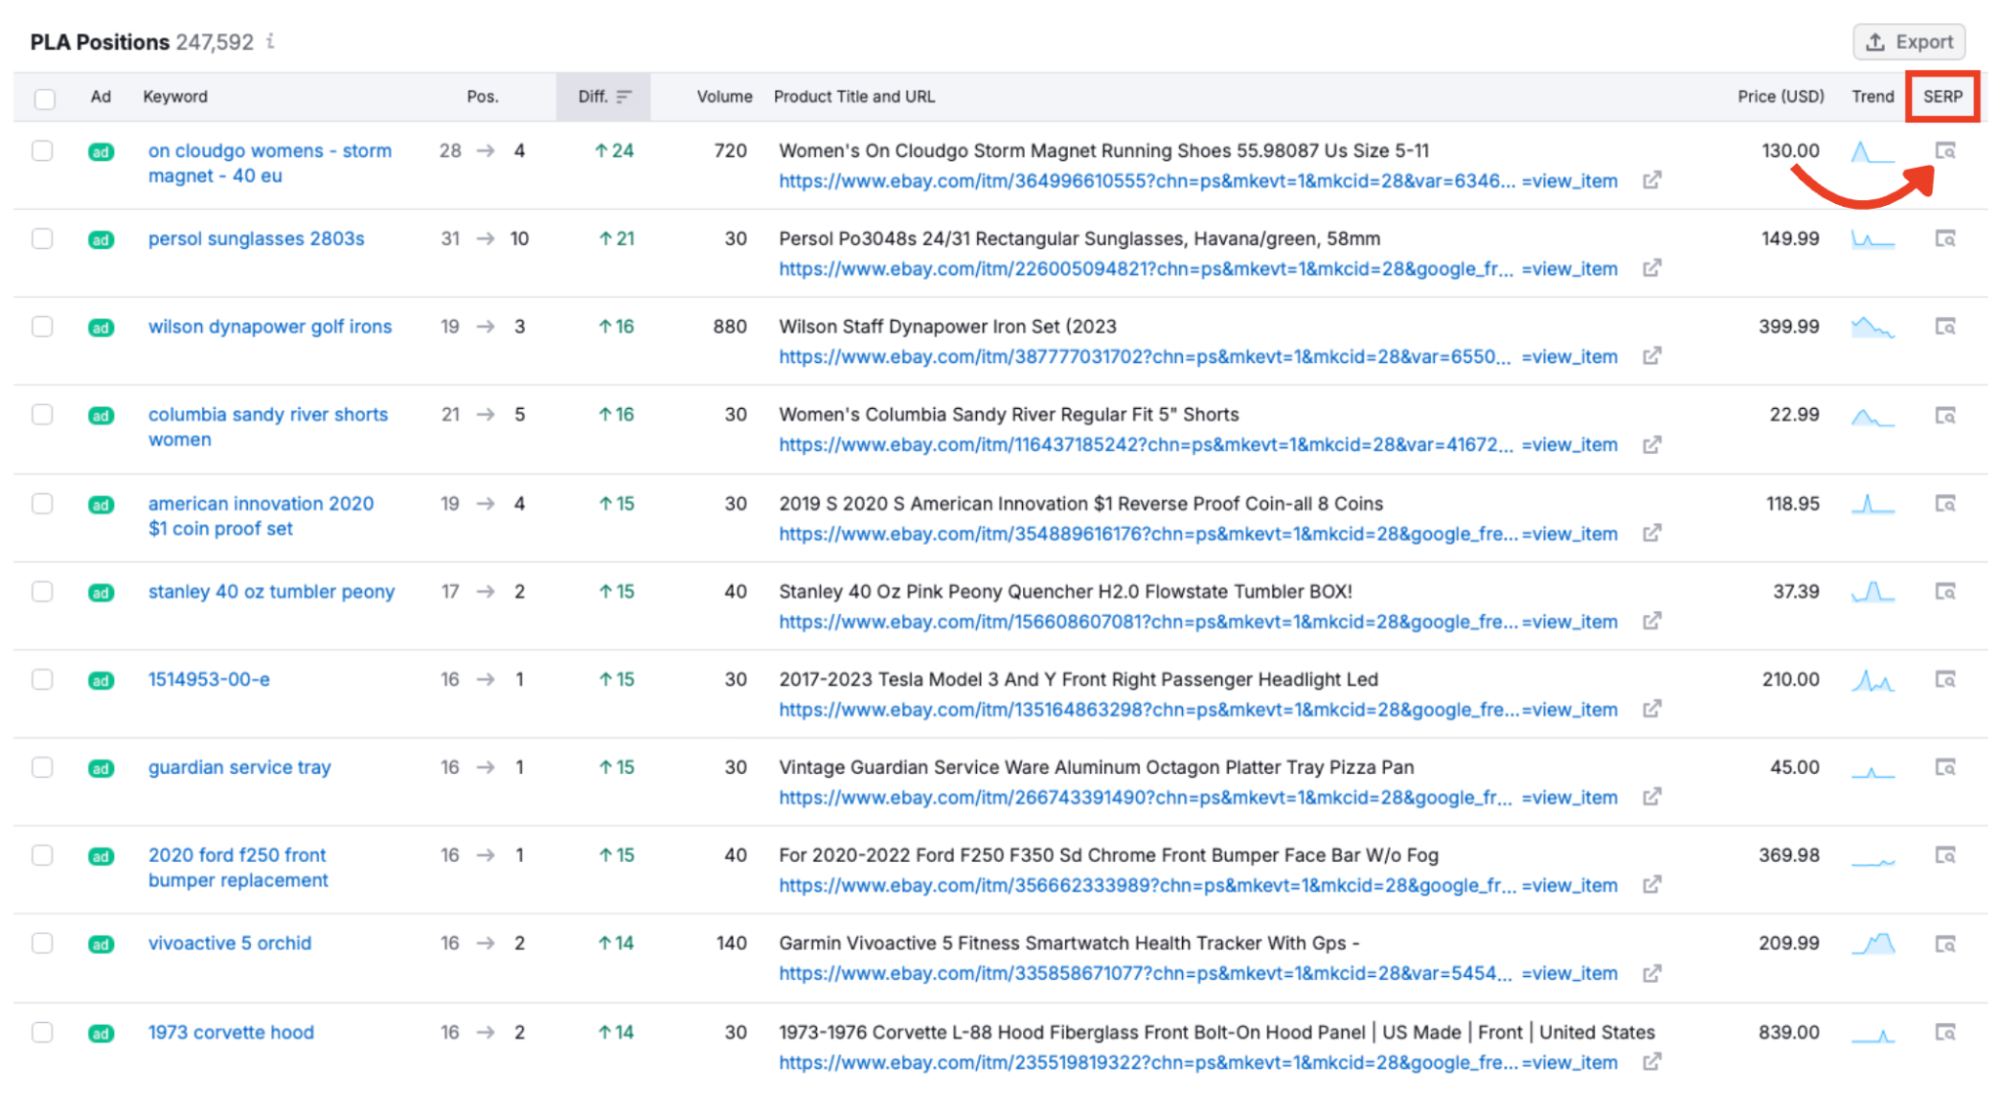
Links to a snapshot of the search results page where the ad appeared. Use this to understand context and competing listings.
You can sort this table using the column headers.

- Sort by position to identify top-ranking ads
- Sort by difference to track performance changes over time
- Sort by volume to prioritize keywords with higher search demand
- Sort by price to spot undercutting competitors
You can also export this data for reporting or analysis. Just click the export button in the top right of the chart.

Choose from CSV, CSV semicolon, or Excel formats, and select how many rows to export.
Your First Step Towards Better Product Listing Ads
The PLA Positions report allows you to dive deep into how and where your competitors’ Google Shopping ads appear.
It is your launchpad for reverse-engineering successful PLA strategies and uncovering gaps in competitor coverage. Paired with the Competitors and PLA Copies reports offered by PLA Research, they holistically give you the necessary insights to build higher-performing Google Shopping campaigns.
To get more PLA insights, head over to the next two tabs:
- The PLA Competitors report maps out which domains you’re up against and how often
- The PLA Copies report allows for creative analysis and ad variation insights
For a wider look at your paid ads performance, check out all the other tools within the Advertising Toolkit to see other areas you can start optimizing.